
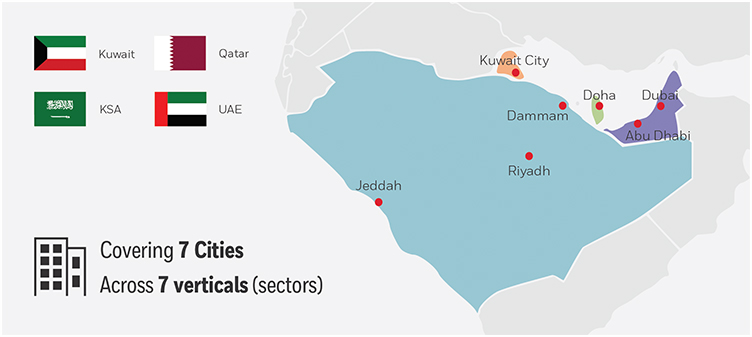
The Honeywell Smart Building Score™ was applied for the first time in the Middle East in more than 600 buildings across seven cities, in four countries.
Newer is NOT always better
No correlation was found between the smartness of a building and how new it is.
Gap between perceived and actual scores
Across all verticals, building managers and owners perceived their buildings to be much smarter than the actual ranking achieved through the Smart Building Score.
Being safe is a primary concern
Although buildings surveyed received an average Safe Score of 48 out of 100 regionally, 70% of building owners and managers believe safety is the most important aspect in a smart building.
 Data source: Nielsen
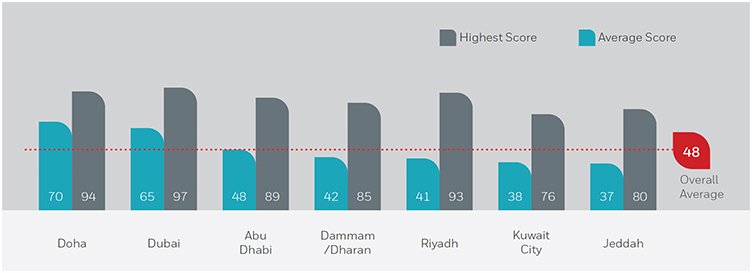
Dubai and Doha lead
Doha and Dubai lead the region in terms of their smart building capabilities across all three categories of Green, Safe and Productive. This is largely attributed to the presence of stronger building regulations in both cities; past and present.
Voluntary leadership and building regulations are crucial
While on average, buildings in Doha and Dubai scored higher than those with less advanced codes, data has shown that each city in the region has leading buildings that have voluntarily applied high international building standards.
 Data source: Nielsen
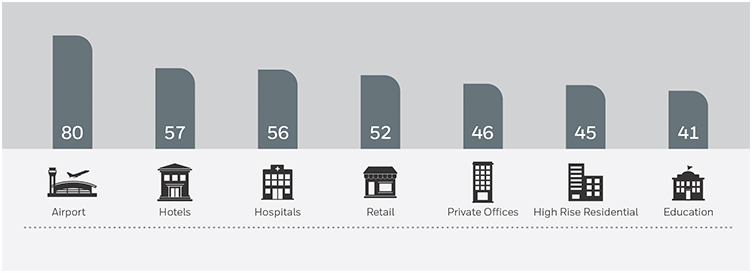
System integration is lagging
With the exception of airports, every vertical across all markets surveyed demonstrated poor integration of their building assets. Integrated building technologies create efficiencies that play a critical role in improving productivity, resource efficiency and safeguarding both lives and property in the event of an incident.
Low asset uptime
'Asset uptime' is the functioning service time of an asset over the course of a year. While investment in smart building assets would improve the score of the verticals, asset uptime is not always fully optimized. The needs of the building and its occupants largely determine what assets are present and how they are distributed, however asset uptime should operate independently from building type.
Given the investment cost associated with assets, it is expected that their operational uptime would ideally be maximized to provide continuous services. This is not the case: the average score of asset uptime across verticals is only 68 out of 100.
 Data source: Nielsen
For more details on the Honeywell Smart Building Score™ download white paper